The Built Asset Lifecycle Platform
Thinkproject is your single source of truth for built asset data and information. Gain a comprehensive set of solutions for key use cases across the built asset lifecycle- all in one integrated platform.
Ensure your teams are in full control with informed decisions, higher efficiency and greater optimisation.
3,000+ customers trust Thinkproject
Announcing: AI for the Built Environment
Thinkproject AI brings intelligent assistants, services, and agents into our platform – unlocking unprecedented gains in productivity and efficiency across asset building and operations.
Discover the difference
Owners, contractors, operators: Get the connected data and software needed to collaborate and successfully plan, build, operate and decommission complex built assets – on one platform.
Make informed decisions with unified built asset data throughout every stage
Thinkproject establishes a Connected Data Ecosystem for your built assets, smoothly integrating all data sources and providing a robust handover solution.
Gain the ability to define, structure, capture, control, analyse, connect and reuse all asset data throughout its lifecycle.
This unlocks a wealth of actionable insights, from prescriptive to predictive, empowering stakeholders at every level to make smart, informed decisions whilst being in full control.
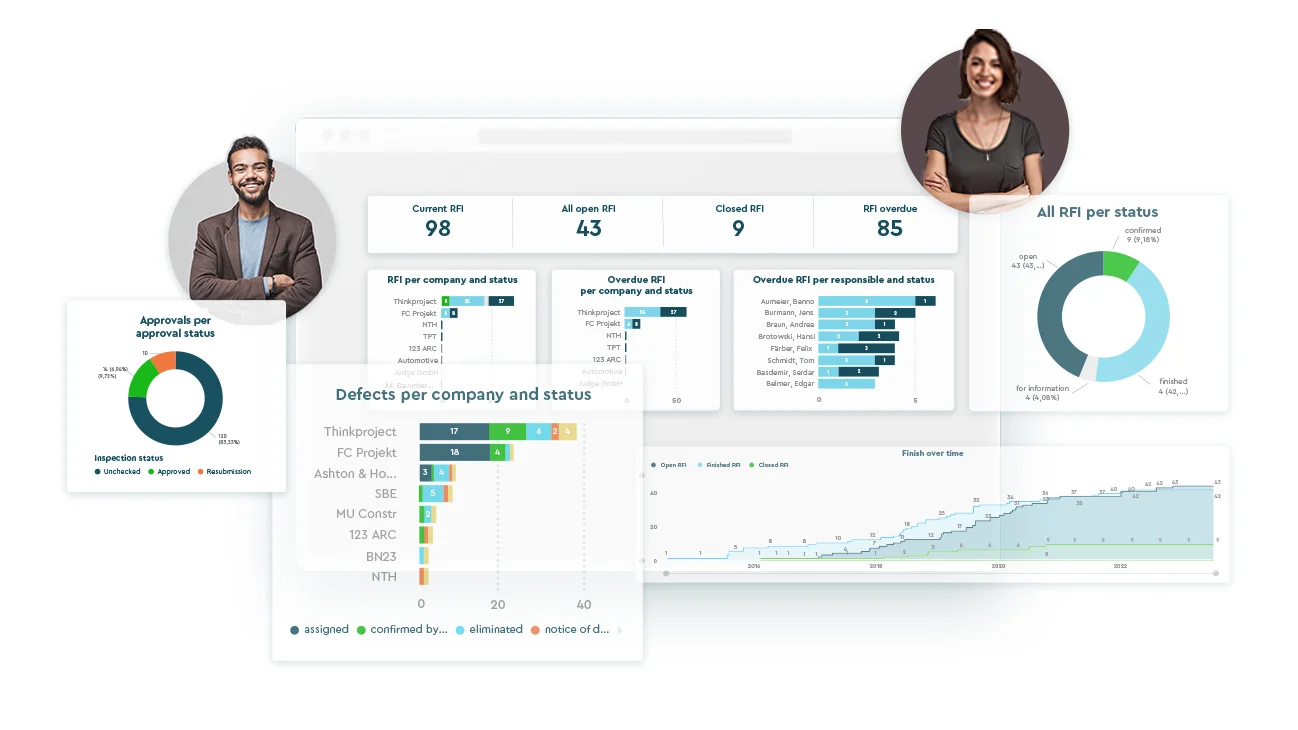

Unlock the power of digitalisation across every asset lifecycle stage
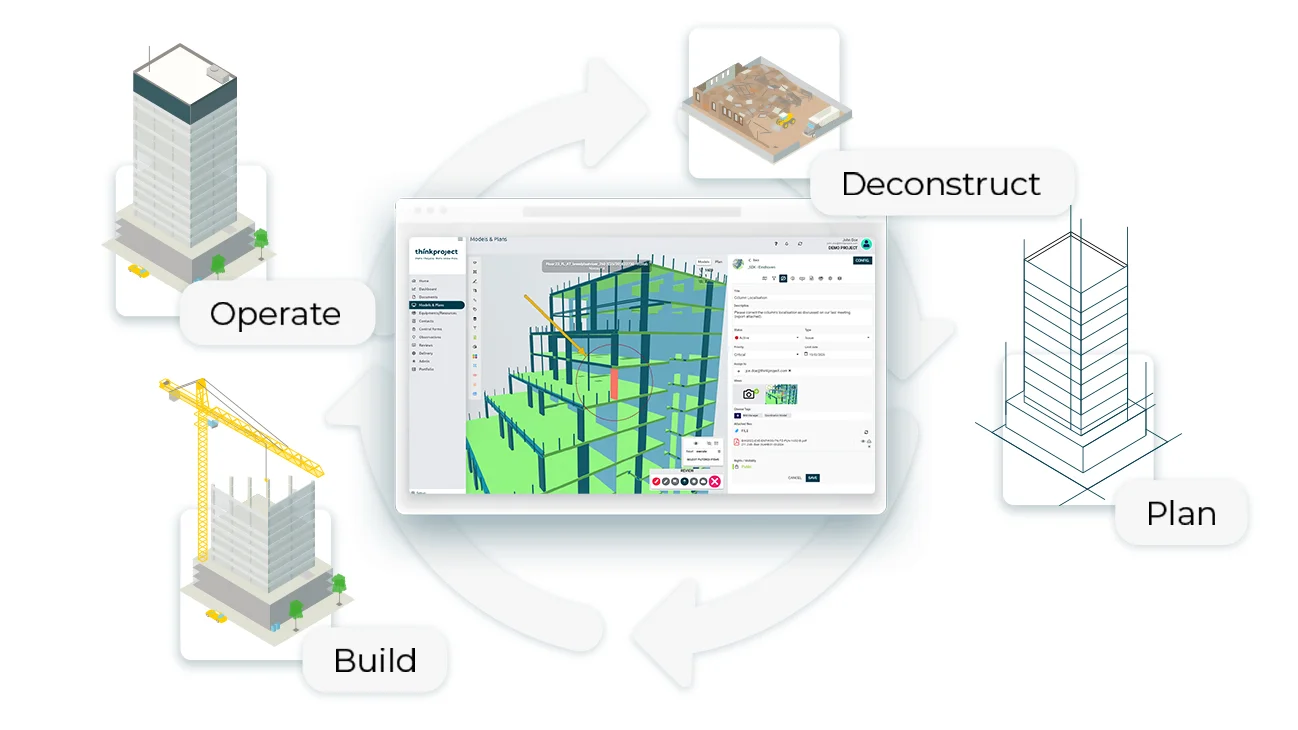
Our innovative approach shifts focus from single projects to the entire built asset lifecycle, expanding your digital strategy beyond construction, to comprehensive Asset Information Management.
Our platform seamlessly connects project and asset stakeholders — contractors, owners, operators and service providers — delivering top-tier solutions and critical data – connected and consistent – throughout the lifecycle.
Empower asset owners with enhanced control and increased ROI.
Reach ultimate efficiency with the most extensive solution portfolio
Choose from over 15 mature first-class solutions, seamlessly integrated in our platform to unlock efficiency and synergy across a wide range of use cases.
Experience unprecedented flexibility by curating your own portfolio of solutions. Match your needs while benefiting from platform synergies.
This adaptable approach lays a sustainable digital foundation, allowing cross-functional use cases and catering to built assets of every size and complexity.
Gain competitive advantages by leveraging platform synergies
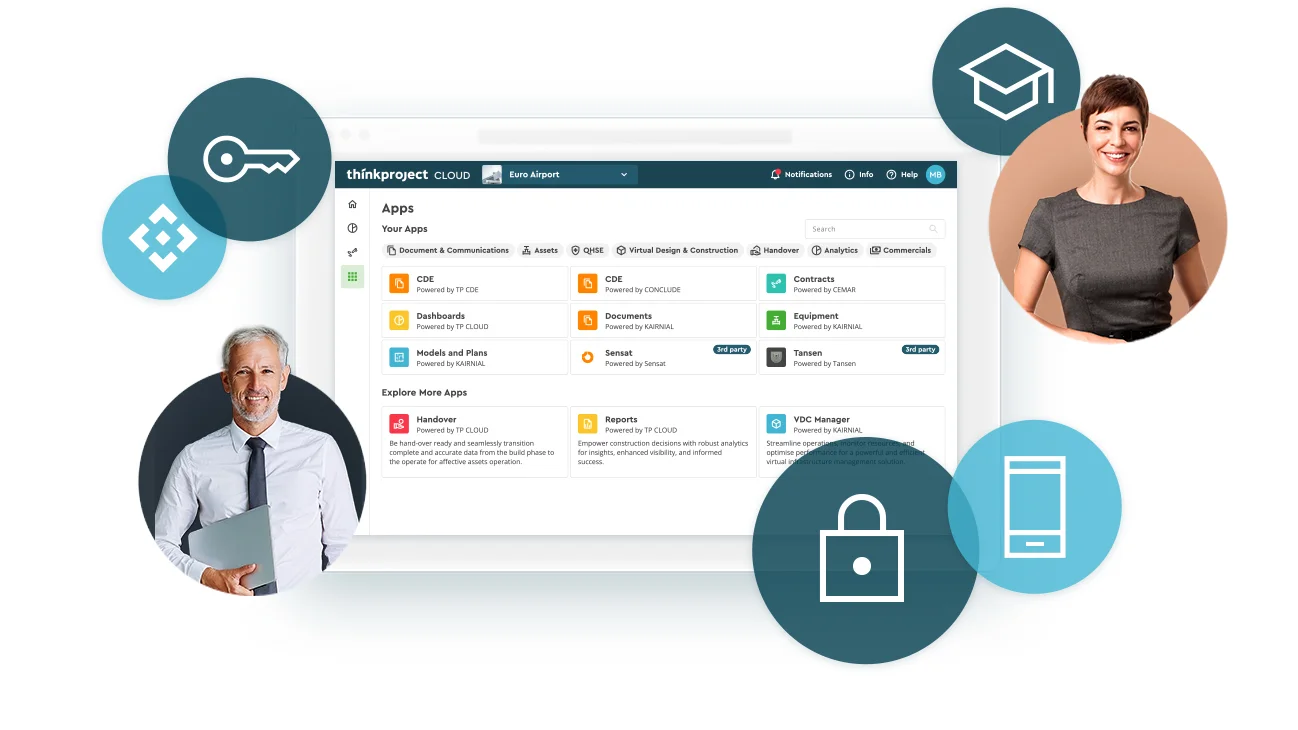
Unprecedented capabilities are afforded through platform-wide services for information retrieval and data sharing.
Simplify and accelerate user adoption with one platform interface through SSO and online access to training.
Secure operations and reduce overhead with a central admin console combined with advanced security concepts and certifications.
Fast and easy integration is standard with a central API framework, also with your existing applications.
Master the requirements of the evolving regulatory landscape
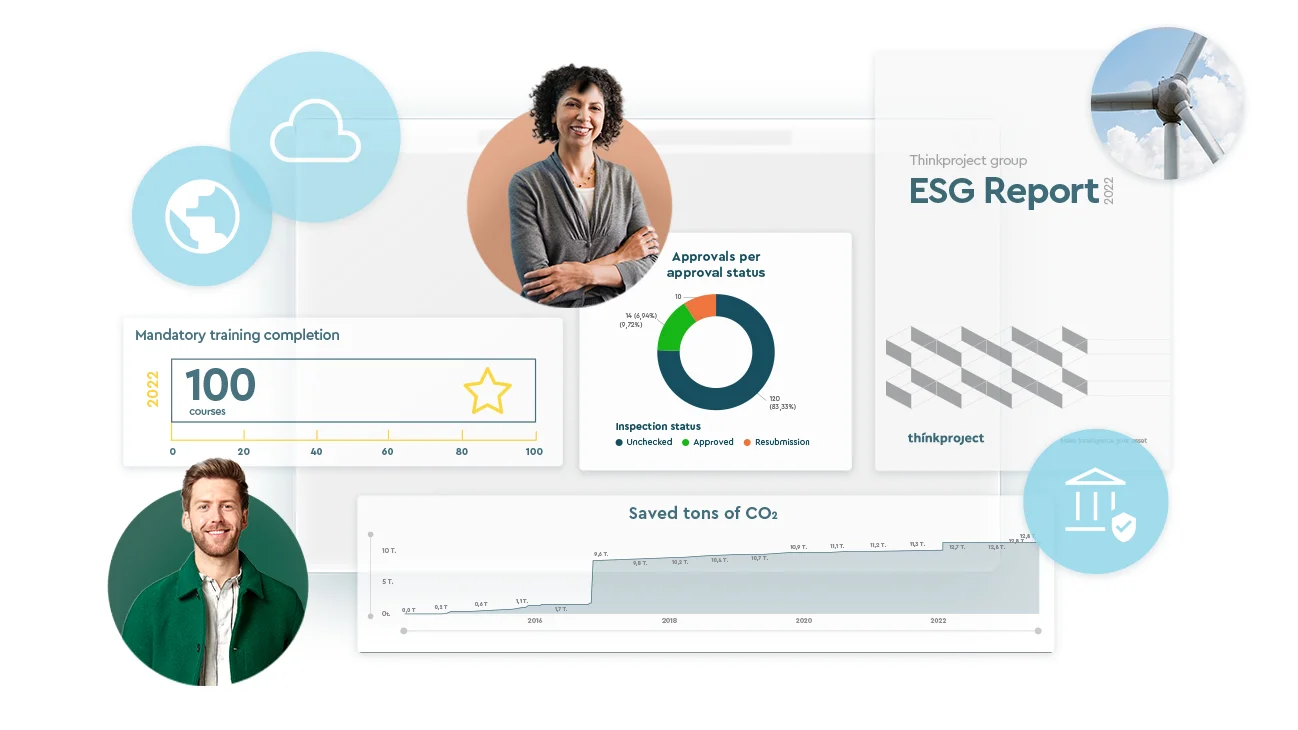
Identify and manage ESG and other regulatory and compliance risks at both asset and project level.
Quickly generate reports on all KPIs and built asset data using a comprehensive dataset, powered by deep integrations and the Connected Data Ecosystem you can create for your assets with Thinkproject.
Whether it‘s new construction or imported data for existing built assets, Thinkproject leaves no gaps, bringing consistency to the entire built asset lifecycle.
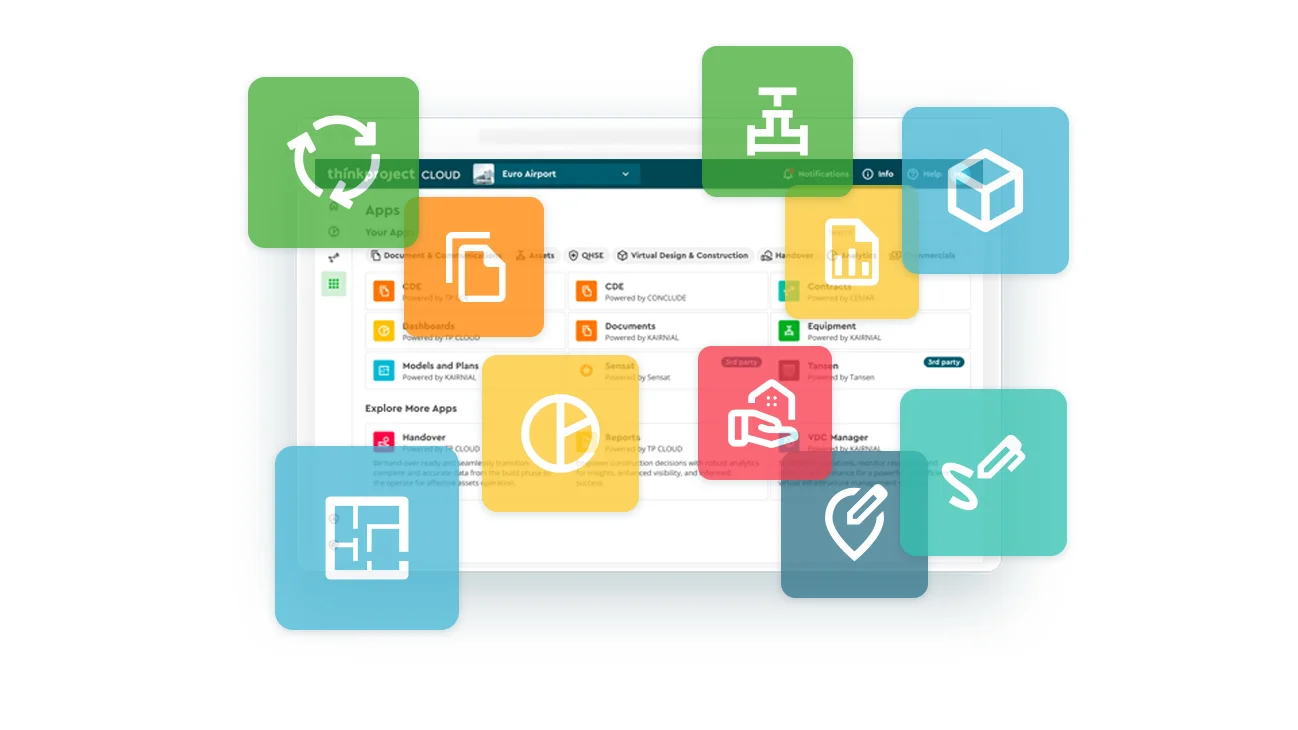
All solutions on Thinkproject in one integrated platform
The solutions in Thinkproject work together in one platform. Explore the business functions and use cases they support, and problems they solve for the entire built asset lifecycle.
Ensures teams remain updated with current information, simplifies connecting communication with data, synchronises tasks and responsibilities, and fosters collaboration.
Improves the design coordination and model assurance, enabling seamless integrations for better efficiency and on-site capabilities.
Combines expertise with practicality, improving quality, safety and environmental compliance in your operations for sustainability.
Turns cross–platform data into comprehensive insights for actionable decisions with our comprehensive BI platform, unlocking immense business value.
Secures the financial success and sustainability of your built assets by encompassing cost control, contract management and tender management.
Allows the seamless transfer of built asset information and structures, of any size and complexity, to the operational phase.
Plays a pivotal role by maximising the value derived from assets while minimising costs and risks, helping organisations improve asset performance.
Encapsulates an entire suite of offerings designed to provide scalable, secure and efficient solutions within the Thinkproject ecosystem and beyond
Thinkproject has come a long way
750000
users
75000
projects
60
countries
15
office locations
